
On analyzing the
performance of gold for an extended period, we found that the metal is hovering
near the support levels. Gold peaked at around USD 1,920 in 2011. In 2012, the
metal failed to post a new high. However, it managed to hold above the low of 2011.
Eventually, gold breached the low of 2012 (1,527) and thereafter declined. The
metal found support near the 38.2% retracement level. Since then, it has been
consolidating. Currently, there is a lack of clear direction. Gold is still in
bearish mode on an extended timeframe. On the monthly charts, momentum oscillators
are hovering in the negative territory. In the long term, the metal could find
support at 1,190. If the metal closes below the mentioned level, it would lead
to further decline. Considering the extended timeframe, we believe gold could
continue to consolidate in the near term. A clear breakout would determine the
direction of the yellow metal in the coming months.
As evident from the weekly charts, gold declined in December
2014 and posted a low of 1,184. Eventually, the metal found support near the
low of June 2013. Considering these technical facts, such formation indicates
that it could be a possible double bottom formation.
In March, we had anticipated that gold would soon bottom
out. The ongoing correction would halt for some time, with likely short-term recovery.
In July, we were confident that the metal would significantly bottom out. Our
argument was supported by fact that it formed higher lows in July and August. As
predicted, the yellow metal bottomed out during the indicated months, with chances
of a potential double bottom. In some cases, a double bottom formation results
in an instant rebound, whereas it might take a few months to develop at other
instances. In this case, the metal is consolidating and making a base
formation.
Currently, gold remains in a fragile state until key
resistance levels are breached on both daily and weekly charts. A trend
reversal is indicated by a higher swing high. However, gold is yet to make a
higher high on the daily as well as weekly charts.
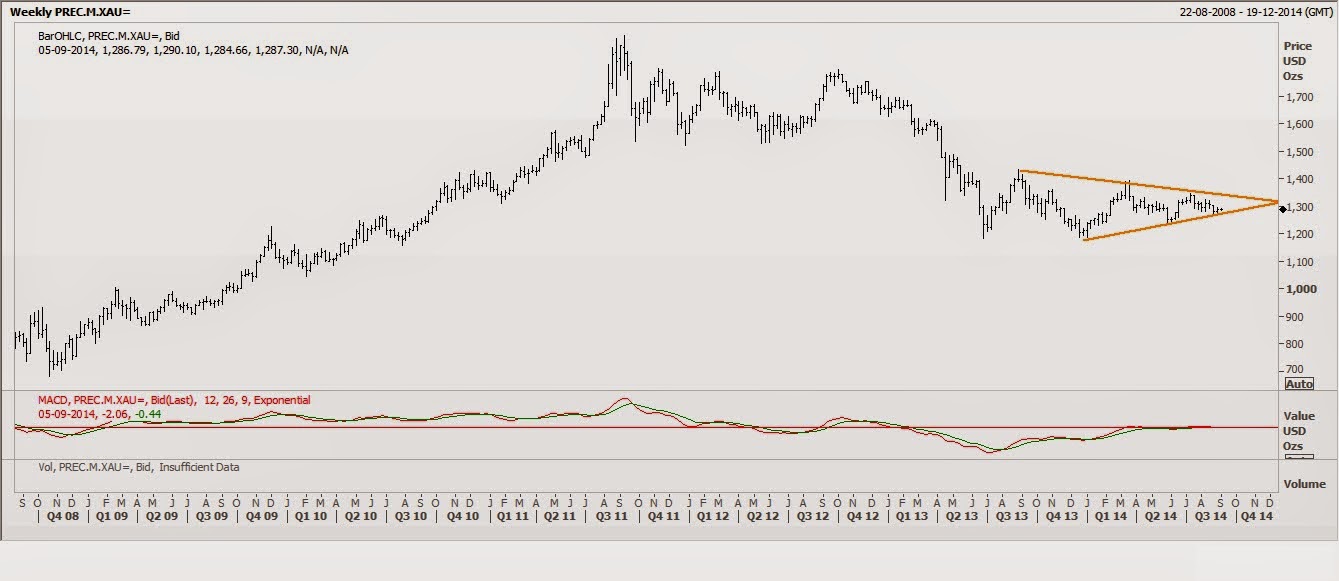
From the weekly charts, we believe gold is consolidating in
a triangular formation over the past 18 months. The metal has tested the trend
line of a triangle on numerous occasions and found support at that level. The
yellow metal appears to move higher. On the weekly charts, gold is maintaining above
the upward sloping trend line and previous swing low. The above technical
studies suggest the possibility of sideways trade.
On the daily
charts, gold posted a lower low for the fourth consecutive trading session. The
metal is trading marginally below the resistance level of 1292.50 (20-day EMA)
and failed to sustain above this level. The metal needs to close below the
20-day moving average crossing to confirm a short-term low. In addition, on the
daily charts, it is making a bearish flag formation. Thus, the yellow metal
continued to appear weak and sideways move is expected. Moreover, daily
momentum oscillators are hovering in the negative terrain. Traders are advised
to take a position on clear breakout.
On the daily
charts, Bollinger bands indicate the price is moving from the lower to higher
band. The price is retreating after testing the upper band. A shift toward the
middle or lower band is expected. On various occasions, the yellow metal can be
seen approaching the lower band, suggesting selling at resistance levels. To
confirm the trend reversal, gold is required to hold above the middle band.
Gold posted a
series of lower highs on the daily charts. The metal failed to hold above USD
1,340 and USD 1, 310. Any gains on the upside need to sustain themselves above
the 20-day EMA to indicate that there could be another attempt to breach USD 1,
310. Any decline below USD1,275 would enable the metal to test the USD 1,250
and USD 1,240 levels.
Comments
Post a Comment