On December 10, the Indian markets witnessed a strong
opening. The gap was more than 2%, well above the record high of 6,357.
However, during the day, the index eased slightly. Eventually, it closed at an
all-time high.
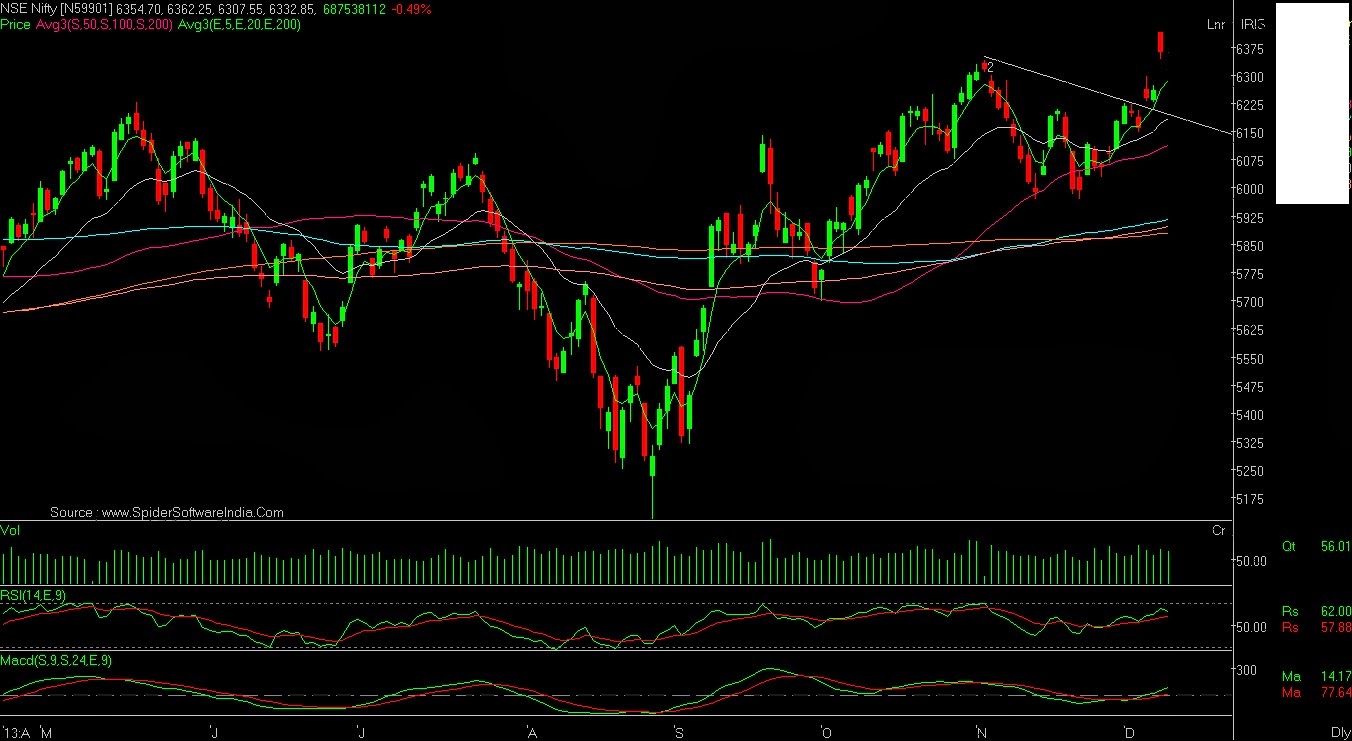
The daily chart is exhibiting a breakaway gap, indicating the
change in sentiment is strong and the coming move will be powerful. We maintain
our positive stance for the coming weeks; we expect higher levels of 6,400 and
6,550. On the daily charts, the bullish breakout from the triangle is still
intact. Moreover, on the monthly charts, the RSI is displaying a value of 61,
suggesting scope for upside in the coming months. However, on Monday, it ended
in a bearish candlestick formation. Weakness below the candle’s low could
attract some profit booking. The breakaway gap could be filled before prices
resume the uptrend. The daily RSI momentum oscillator is exhibiting negative
divergence, signaling caution. A close below 6,280 would indicate that the
current momentum is fading. In the medium term, 6,170 and 6,060 could act as
the demand zone.
 |
| Add caption |
On 07th March, Nifty posted a high of 6,537
ReplyDeleteOn 2nd Feb Nifty closed at 6000. and since then it has been inching higher.
ReplyDelete